Friday, August 31, 2012

What is Google BigQuery?

Big Data and Cloud – these two words are talk of IT Industry town in last few quarters. All the major players of IT word such as Amazon (AWS), Microsoft (Windows Azure, SQL Azure, Government Cloud and many more) , Google (Google App Engine, Google Compute Engine, Google Cloud Storage and Google BigQuery) etc. are offering cloud based tools and services and there a lot of successful stories and case study on their web sites about their clients who are using these services and tools. The introduction of Google BigQuery in November 2011 has added a power tool in the Google’s list of cloud servicing.

In a very simple term, Google BigQuery is platform to store data into Google cloud and analyze this data by writing SQL-like queries. With Google Big Query, you store the data into large datasets. These datasets contains one or more tables which are referred as BigTables. These BigTables can store billions of row or hundred terabytes of data and you can read these data in seconds. Data stored in these BigTables can be retried by writing SQL-Like queries just like you query SQL, Oracle or any other DBMS/RDBMS.

Among the many advantages that BigQuery offer speed is one of the significant advantages. The large datasets or BigTables data can be retrieved in few seconds from anywhere in the world. BigData is OLAP (Online Analytics Processing system) tool that let your analyze your terabytes of data quickly. BigData is not a Big Data tools such as Hadoop, Netezza, or Vertica but it gives you flexibility to store and analyze your humongous data quickly.

How to start with BigQuery?

To use BigQuery services to store your data into Google cloud and further analyze it, you need to have a Google account. You have to follow the two step process to activate your BigQuery and BigTable access with Google.

  1. You have to enable BigQuery API access into Google API console
  2. You have to enable Billing into Google API console

Google BigQuery services are free, if you are storing and reading your data within the Quota limit that Google have setup. You are charged if you are crossing the free quota limit.

Step 1: Enable BigQuery API into Google API console

Google API console is an online interface provided by Google to mange access, authorization and billing for the Google API uses. When you login into Google API console for the first time, you need to create a project.

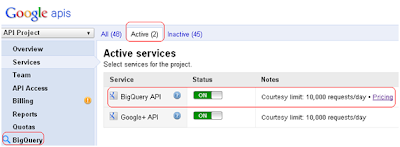
By default the project is created with the name “API Project”. You need to go to Services and click on BigQuery API.

Your BigQuery API access will be enabled and on left side of panel BigQuery will be added as a label. BigQuery API will be shown into Active Services with a green ON button.

Step 2: Enable Billing

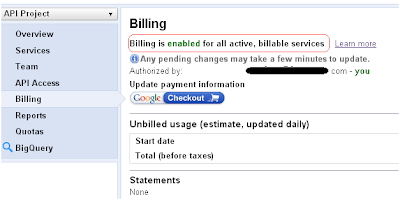
The second step involves enable billing. It is not that you will be charged every time you use Google Big Query services. It is just to ensure that if are crossing the Quota limit set by Google, you will be charged. To enable Billing, you need to click on Billing. By default Billing is not enabled. You need to click on the button just below Enable Billing.

You need to provide your credit card details. Google wallet accepts all Master card, Visa card, AMEX cards. If you are apprehensive about sharing your credit card details, may be you can try with a pre-paid credit card.

In my case, when I activated billing and created a sample BigTable, I was charged INR 1. This is to part of Google Validation of your credit cards.

Once you are done with the two steps process, your access to BigQuery is established. You can use the BigQuery services by logging into https://bigquery.cloud.google.com/ . You can create BigTables, store data into tables, write queries and play around with them.

That is all for this post. In next post we will see how we can create BigTables and store data into Google BigTables.

Thursday, August 23, 2012

Google Analytics API with .NET
How to pull Visitor Type statistics from Google Analytics Dashboard?

This article is next in series of our learning Google Analytics API with .NET. In our last articles we learn how to pull browser statistics report from Google Analytics dashboard using Google Analytics API.
Today we will learn to pull Visitor Type statistics reports from Google Analytics dashboard. Google Analytics dashboard reports show you new and returning visitors to your website. When you click on Behavior->New vs Returning, Google Analytics dashboard will show how people are behaving to see your web page or web site. Are you getting the new users or returning users to your web asset.
To pull this information into .NET using Google Analytics API, we will use the following .NET interface. In ListView2 we will display new and returning visitor’s statistics.
We have following code logic on Show All Profiles button, which pull all the profiles information from Google Analytics account.
private void button1_Click(object sender, EventArgs e)
{
  //Add LisView Column headings

  listView1.Columns.Add("ProfileName");
  listView1.Columns.Add("ProfileID");
  listView1.FullRowSelect = true;

  AnalyticsService GAService = new AnalyticsService("VikTest-GA-App");
  AccountQuery GAQuery = new AccountQuery();

  //Pass Google account credentials
  GAService.setUserCredentials(textBox1.Text, textBox2.Text);

  //Create Google Account Feed
  AccountFeed GAFeed = GAService.Query(GAQuery);
  foreach (AccountEntry entry in GAFeed.Entries)
  {
  
  listView1.Items.Add((new ListViewItem(new string[] { entry.Title.Text, entry.ProfileId.Value})));
  }

}
We have following code logic on Show button. To pull visitor type statistics we have to supply ga:VisitorType as Dimension and ga:Visitors as Metrics. Google Analytics understands the dimension and metrics. By specifying the dimension and metrics you are telling to Google Analytics what part of data you want to retrieve from Google Analytics dashboard.
private void button2_Click(object sender, EventArgs e)
{
  string VisitorTypeName;
  listView2.Columns.Add("VisitorType");
  listView2.Columns.Add("NoOfVist");
  listView2.FullRowSelect = true;

  AnalyticsService GAService = new AnalyticsService("VikTest-GA-App");
  //Pass Google account credentials
  GAService.setUserCredentials(textBox1.Text, textBox2.Text);

  DataQuery query = new DataQuery("https://www.google.com/analytics/feeds/data");
  query.Ids = listView1.SelectedItems[0].SubItems[1].Text;
  query.Metrics = "ga:visitors";
  query.Dimensions = "ga:visitorType";
  
  
  query.Sort = "ga:visitorType,ga:visitors";
  query.GAStartDate = Convert.ToDateTime(textBox3.Text).ToString("yyyy-MM-dd"); 
  query.GAEndDate = Convert.ToDateTime(textBox4.Text).ToString("yyyy-MM-dd"); 

  DataFeed dataFeed = GAService.Query(query);
  foreach (DataEntry entry in dataFeed.Entries)
  {
   VisitorTypeName = entry.Title.Text.ToString().Substring(4, (entry.Title.Text.Length - 4));
   listView2.Items.Add(new ListViewItem(new string[] { VisitorTypeName, entry.Metrics[0].Value }));


  }
}
After setting up the code logic and interface we need to connect to internet and has to supply our google credentials. We have to enter data range for which we want to retrive
data and click on Show. The results were as expected. The code logic pulls the data from Google Analytics report about visitor type statistics.


Please note this article was created using Google Analytics API version 2.3. As per Google Analytics Notification this feed has been shutdown.


Google Analytics API with .NET
How to pull your web site speed statistics from Google Analytics?

To continue our learning towards Google Analytics API with.NET, in this post we will learn how we can pull our web site speed statistics from Google Analytics dashboard. Google tracking code that we setup in our website or webpage tracks the Page load time, Domain lookup time, Server response time, Server connection time etc. When we login into Google Analytics account and see the dashboard

In .NET we have following windows interface. We have two text boxes to supply Google credentials. Show All Profiles button contains the code logic to pull all the profiles that we have setup with our Google Analytics account. We have another two text boxes to enter date range for which we want to pull data. Show button contains the code logic to connect with Google Analytics feed and pull the web site speed statistics.

The .NET code logic on Show All Profiles button is following:

private void button1_Click(object sender, EventArgs e)
{
 //Add LisView Column headings

 listView1.Columns.Add("ProfileName");
 listView1.Columns.Add("ProfileID");
 listView1.FullRowSelect = true;

 AnalyticsService GAService = new AnalyticsService("VikTest-GA-App");
 AccountQuery GAQuery = new AccountQuery();

 //Pass Google account credentials
 GAService.setUserCredentials(textBox1.Text, textBox2.Text);

 //Create Google Account Feed
 AccountFeed GAFeed = GAService.Query(GAQuery);
 foreach (AccountEntry entry in GAFeed.Entries)
 {
  
  listView1.Items.Add((new ListViewItem(new string[] { entry.Title.Text, entry.ProfileId.Value})));
 }

}

The code logic on Show button is following. We are supplying ga:pageLoadTime into Metrics as we want to pull page load time statistics.

private void button2_Click(object sender, EventArgs e)
{
 double SpeedTimeinSec;
 listView2.Columns.Add("PageSpeedType");
 listView2.Columns.Add("Speed in Seconds");
 listView2.FullRowSelect = true;

 AnalyticsService GAService = new AnalyticsService("VikTest-GA-App");
 //Pass Google account credentials
 GAService.setUserCredentials(textBox1.Text, textBox2.Text);

 //PageLoadTime
 DataQuery query = new DataQuery("https://www.google.com/analytics/feeds/data");
 query.Ids = listView1.SelectedItems[0].SubItems[1].Text;
 query.Metrics = "ga:pageLoadTime";
  
 query.GAStartDate = Convert.ToDateTime(textBox3.Text).ToString("yyyy-MM-dd");
 query.GAEndDate = Convert.ToDateTime(textBox4.Text).ToString("yyyy-MM-dd"); 

 DataFeed dataFeed = GAService.Query(query);
 foreach (DataEntry entry in dataFeed.Entries)
 {
  SpeedTimeinSec=Convert.ToInt32(entry.Metrics[0].Value) * 0.0010;
  listView2.Items.Add(new ListViewItem(new string[] {"PageLoadTime",SpeedTimeinSec.ToString()}));
 }

}

After setting up the code logic, we need to connect to internet. We need to supply our identity to Google and click on Show All Profiles. Next we need to supply data range and click on Show button. The code logic works as expected and it pull down the Page Load time for this website (www.singhvikash.blogspot.com).
You can supply following Metrics values if you want to pull information such as Domain Lookup time, Server response time etc.

ga:domainLookupTime
ga:pageDownloadTime
ga:redirectionTime
ga:serverConnectionTime
ga:serverResponseTime

For a complete list of Dimension and metrics values for website speed you can visit following Google link. https://developers.google.com/analytics/devguides/reporting/core/dimsmets/sitespeed


Please note this article was created using Google Analytics API version 2.3. As per Google Analytics Notification this feed has been shutdown.


Wednesday, August 22, 2012

Google Analytics API with .NET
How to pull Search Engines statistics report for your web site from Google Analytics Dashboard?

This article is in continuation towards our learning Google Analytics API with .NET. In our last articles we learn how to pull browser statistics and visitor type statistics report from Google Analytics dashboard using Google Analytics API.

In this post we will learn to pull search engine statistics report for your web site. Does your web site features in the search result list of search engines? Do the visitors actually go to your web sites when they searching using various Search engines such as Google, Bing, Yahoo etc.? Google Analytics Traffic Source Dimension shows you this repot when you click on Search and Overview.

You can pull this information into .NET using Google Analytics API. We will use the following .NET interface. In ListView2 we will display how many visitors you received from Search engines.

We have following code logic on Show All Profiles button, which pull all the profiles information from Google Analytics account.

private void button1_Click(object sender, EventArgs e)
{
  //Add LisView Column headings

  listView1.Columns.Add("ProfileName");
  listView1.Columns.Add("ProfileID");
  listView1.FullRowSelect = true;

  AnalyticsService GAService = new AnalyticsService("VikTest-GA-App");
  AccountQuery GAQuery = new AccountQuery();

  //Pass Google account credentials
  GAService.setUserCredentials(textBox1.Text, textBox2.Text);

  //Create Google Account Feed
  AccountFeed GAFeed = GAService.Query(GAQuery);
  foreach (AccountEntry entry in GAFeed.Entries)
  {
   
   listView1.Items.Add((new ListViewItem(new string[] { entry.Title.Text, entry.ProfileId.Value})));
  }

}

We have following code logic on Show button. To pull Search engine statistics we have to supply ga:source as Dimension and ga:organicsSearches as Metrics. Google Analytics understands the dimension and metrics. By specifying the dimension and metrics you are telling to Google Analytics what part of data you want to retrieve from Google Analytics dashboard.
private void button2_Click(object sender, EventArgs e)
{
  string SearchEngineName;
  listView2.Columns.Add("SearchEngine");
  listView2.Columns.Add("NoOfSearches");
  listView2.FullRowSelect = true;

  AnalyticsService GAService = new AnalyticsService("VikTest-GA-App");
  //Pass Google account credentials
  GAService.setUserCredentials(textBox1.Text, textBox2.Text);

  DataQuery query = new DataQuery("https://www.google.com/analytics/feeds/data");
  query.Ids = listView1.SelectedItems[0].SubItems[1].Text;
  query.Metrics = "ga:organicSearches";
  query.Dimensions = "ga:source";


  query.Sort = "ga:organicSearches,ga:source";
  query.GAStartDate = Convert.ToDateTime(textBox3.Text).ToString("yyyy-MM-dd");
  query.GAEndDate = Convert.ToDateTime(textBox4.Text).ToString("yyyy-MM-dd"); 
  DataFeed dataFeed = GAService.Query(query);
  foreach (DataEntry entry in dataFeed.Entries)
  {
   SearchEngineName = entry.Title.Text.ToString().Substring(10, (entry.Title.Text.Length - 10));
   if (entry.Metrics[0].Value !="0")
   {
    listView2.Items.Add(new ListViewItem(new string[] { SearchEngineName, entry.Metrics[0].Value }));
   }

  }
}

After setting up the code logic and interface we need to connect to internet and has to supply our google credentials. We have to enter data range for which we want to retrive data and click on Show. The results were as expected. The code logic pulls the data from Google Analytics report about search engine statistics.


Please note this article was created using Google Analytics API version 2.3. As per Google Analytics Notification this feed has been shutdown.


Monday, August 20, 2012

Google Analytics API with .NET
How to pull Browser statistics from Google Analytics Dashboard?

This article is next in series of our learning Google Analytics API with .NET. In our last article we learn about Dimension and Metrics and we pull Google Analytics profiles using Google Analytics API.

Today we will learn to pull Browser statistics reports from Google Analytics dashboard. When you log in to your Google Analytics accounts, on the left panel you see a lot of dimension. When you click on Technology->Browser & OS, Google Analytics dashboard will show what browser people are using to see your web page or web site.

To pull this data into .NET, we need to understand that Google Analytics Dashboard is all about Dimension and Metrics. Dimension in this case is Browser & OS which is represented as ga:browser and Metrics is represented as ga:pageviews when we are using Google Analytics API. To pull data from Dashboard Google Analytics provides DataQuery and DataFeed. In DataQuery we mention the Dimension and Metrics.

Let us see the example for this into .NET. We have following .NET interface.

We have two ListView control on the form to show profiles and Browser Statistics. We have two text boxes to supply Google Credentials. We have next two text boxes to supply data range for which we want to pull data from Google Analytics dashboard.

We have following code logic on button Show Allow Profiles to see pull all profiles information from Google Analytics.

private void button1_Click(object sender, EventArgs e)
{
 //Add LisView Column headings

 listView1.Columns.Add("ProfileName");
 listView1.Columns.Add("ProfileID");
 listView1.FullRowSelect = true;

 AnalyticsService GAService = new AnalyticsService("VikTest-GA-App");
 AccountQuery GAQuery = new AccountQuery();

 //Pass Google account credentials
 GAService.setUserCredentials(textBox1.Text, textBox2.Text);

 //Create Google Account Feed
 AccountFeed GAFeed = GAService.Query(GAQuery);
 foreach (AccountEntry entry in GAFeed.Entries)
 {
 
 listView1.Items.Add((new ListViewItem(new string[] { entry.Title.Text, entry.ProfileId.Value})));
 }

}

We have following code logic on button Show to pull Browser statistics information from Google Analytics dashboard.

private void button2_Click(object sender, EventArgs e)
{
 string browserName;
 listView2.Columns.Add("BrowserName");
 listView2.Columns.Add("NoOfVist");
 listView2.FullRowSelect = true;

 AnalyticsService GAService = new AnalyticsService("VikTest-GA-App");
 //Pass Google account credentials
 GAService.setUserCredentials(textBox1.Text, textBox2.Text);

 DataQuery query = new DataQuery("https://www.google.com/analytics/feeds/data");
 query.Ids = listView1.SelectedItems[0].SubItems[1].Text;
 query.Metrics = "ga:pageviews";
 query.Dimensions = "ga:browser";
 query.Sort = "ga:browser,ga:pageviews";
 query.GAStartDate = Convert.ToDateTime(textBox3.Text).ToString("yyyy-MM-dd"); 
 query.GAEndDate = Convert.ToDateTime(textBox4.Text).ToString("yyyy-MM-dd"); 

 DataFeed dataFeed = GAService.Query(query);
 foreach (DataEntry entry in dataFeed.Entries)
 {
 browserName = entry.Title.Text.ToString().Substring(11, (entry.Title.Text.Length - 11));
 listView2.Items.Add(new ListViewItem(new string[] { browserName, entry.Metrics[0].Value }));


 }
}

After designing you .NET interface and code logic, I connected to internet and run the form. I supplied my Google account credentials and click on Show All Profiles. The results were as expected.

I entered a start data and end date as I want to see data from 1st Aug 2012 to 20th Aug 2012 and clicked on button Show. The browser statistics was shown in ListView2.

So this is how we can pull the browser statistics reports from Google Analytics dashboard.

Thanks for reading this post.


Please note this article was created using Google Analytics API version 2.3. As per Google Analytics Notification this feed has been shutdown.


Google Analytics API with .NET
How to pull profile information from Google analytics?

This post is in continuation of our learning Google Analytics API. In the last post we learn what is Google Analytics and we setup our profile with Google Analytics. We also learn how to setup Google analytics tracking code in our web site.

Once you put the Google analytics tracking code in your web page, Google Analytics start tracking your page statistics. Every time you login to Google Analytics to see your web statistics, you are greeted with the the following screen. You can select the profile for which you want to see web statisics. With your Google Analytics account, you can setup more than one profile.You can track statistics for one web page or complete web site or your multiple web sites by creating differet profiles. So you need to pick which profile you want to see from the below screen.

Once you click the profile name, you are taken to Standard Reporting dashboard. You can see the visitor’s overview to the right side of the panel.

From the left side of panel you can select the section for which you want to see the reports. If you want to see what browser people are using to see your web page, you can select Browser and OS from the left panel and Google Analytics will show you statistics about that. Is not that great you can design your web page to best suited browser that people are using to see your web content.

The sections on the left side are called Dimension. Dimensions are segments or sections of report against which you want to see the count. Metrics are the count that you see on the report. So in case you selected Browser and OS and you see the counts against it, you just interact with one Dimension and Metrics of Google Analytics report.

As you play around with Google Analytics Dashboard you will be more familiarized with the reports.

Now coming back to our objective to learn Google Analytics API, as discussed in the last post if you have installed the .NET client library, you can pull the statistics that is shown on the Google Analytics Dashboard to your .NET program.

Google Data API provides a namespace Google.GData.Analytics that you can use to read your web statistics. Let us try to pull all profile information from Google Analytics using our .NET program.

To start with I have design following .NET form. It has two label and two text boxes where you will supply your Google account credentials. There is a button on the form Show All Profiles. When you click on the button, the code logic written on the form will interact with Google Analytics feed and return the profile information.

I am using following namespaces that come with the Google Data API that I installed.

using Google.GData.Analytics;
using Google.GData.Extensions;

I have following code logic on the button control. We will be pulling Profile name and profile id from the Google Analytics feed. The coding logics is self-explanatory. We are creating an instance of Analyticsservice and have given our instance a name. We are creating an AccountQuery because we want to query account information. We are passing the account query to Account feed which interacts with Google Analytics and pull the feed entries. Each feed entry represents a profile.

private void button1_Click(object sender, EventArgs e)
{
 //Add LisView Column headings

 listView1.Columns.Add("ProfileName");
 listView1.Columns.Add("ProfileID");
 listView1.FullRowSelect = true;

 AnalyticsService GAService = new AnalyticsService("VikTest-GA-App");
 AccountQuery GAQuery = new AccountQuery();

 //Pass Google account credentials
 GAService.setUserCredentials(textBox1.Text, textBox2.Text);

 //Create Google Account Feed
 AccountFeed GAFeed = GAService.Query(GAQuery);
 foreach (AccountEntry entry in GAFeed.Entries)
 {
  
  listView1.Items.Add((new ListViewItem(new string[] { entry.Title.Text, entry.ProfileId.Value})));
 }

}

Once you are done with design part, you need to check you are connected with the internet. Since you are interacting with an online source, you need to be on internet to run your .NET Form. I run the form and supplied my Google credentials and clicked on Show All Profiles button. The code logic work as expected and pulled the profile information and show it on the listview.


Please note this article was created using Google Analytics API version 2.3. As per Google Analytics Notification this feed has been shutdown.


Saturday, August 18, 2012

How to get started with Google Analytics API

In Cyberspace every web developer or web master aims to create a niche website, blog or web asset which is liked and admire by its readers. Web developers or web masters love to know the fact how popular their contents are in web world. Knowing the statistics of your web page is really exciting. Today we have many platforms available to know our web statistics. Some of the popular platform which helps you to track your website or blog statistics are following:

  • Google Analytics
  • Alexa
  • AWStats
  • StatsCounter
  • Feedburner
  • ...and many more
  • Google Analytics is one of leading platform to track your web statistics. Google Analytics provides API which you can use to query your web statistics using your own programs developed in Java, PHP, .NET, JavaScript etc.

    How to use Google Analytics to track your web statistics?

    If you want to use Google Analytics to track your web statistics such as Page Visit, Country wise web visit, Browser wise page visit etc. all you need is a Google Account.

    The very first thing you have to do after login with your Google account is to Sign up with Google Analytics. You need to create an account for your website or blog that you want to track.

    Once you successfully create your account, Google Analytics gives you a tracking Id.

    You can click on Standard Tracking Code and Google analytics will give you a tracking code. You need to put this code in your web page or web site or web blog that you want to track.

    Once you put this tracking code in your web pages, you are all set. You can login into Google Analytics and click on your profile to see your web statistics.

    The good thing about Google Analytics is that it provides API which you can use to develop your own programs to get to know your web statistics. These API are available in the form of client libraries to developers in many languages such as Java, Python, .NET, PHP, JavaScript etc.

    In case you want to use .NET based client library and build your own tool to know your web statistics, you need to download Google Data API library from http://code.google.com/p/google-gdata/downloads/list. You can show your web statistics on your web page, active users on your website on your website using Google Analytics API.

    Once you register with Google Analytics and explore the reporting dashboard, you will know how powerful Google Analytics is to track your web statistics.

    We will explore the Google Analytics API in this series. Till then you can download the .NET client library of Google Data API


    Thursday, August 16, 2012

    SSIS: 3 Ways to resolve Unicode and non-unicode data type issue?

    One of the common problem that we came across into SSIS is conversion of Unicode and non-unicode data type. This happens, when we are passing data from a unicode source to non-unicode destination or vice versa.

    If the soruce and destination happens to be a DBMS or RDMBS system like SQL Server, Oracle etc. there are built-in mechanism or conversion functions that can be used to convert data from one format to another. For exampel with SQL Server you can use CAST or CONVERT function to convert your data before passing it to a destination.

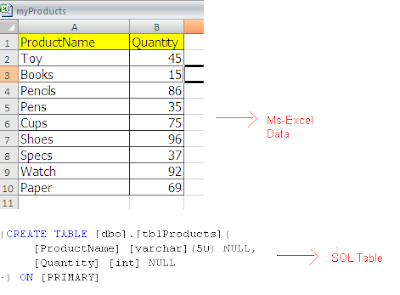
    If you are dealing with Ms-Excel source, you have two choices available into SSIS that you can use. Let us consider a typical scenario when we have a MS-Excel Source and a SQL Server table as Destination.

    When we connect the Excel Source to OLE DB Destination into SSIS design, we get the error that cannot convert between unicode and non-unicode string data type.

    To resolve this issues we have following two solutions available into SSIS>

    Derived Column Solution :

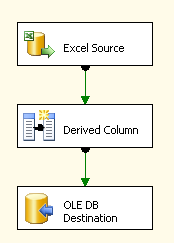
    We can add a Derived Column Component between Excel Source and OLE DB Destination.

    Inside the Derived column component, we can add a new column (strProductName) and use Type Cast operator DT_STR, which converts the Unicode data column to string data column.

    Inside the OLE DB Destination we can map the Derived Column (strProductName) with the table column.

    Data Conversion Solution:

    We can add a Data Conversion Component between Excel Source and OLE DB Destination.

    Inside the Data Conversion component, we can convert the columns data type from Unicode to string.

    Inside the OLE DB Destination we can map the Output Alias Column (strProductName) with the table column.

    There is a third solution for this problem but this solution is applicable if your source is a Flat file with Unicode data.

    Flat File Solution:

    You can right click on Flat File Source and go to Show Advanced Editor. You can go to the Input and Output Properties tab. You need to select OutPut Columns and change the data type to string.

    This way the output columns is passed to the OLE DB Destination as string and running the SSIS package will complete successfully.

    That is all for this post. Thanks for reading till this along.

    Popular Posts

    Real Time Web Analytics